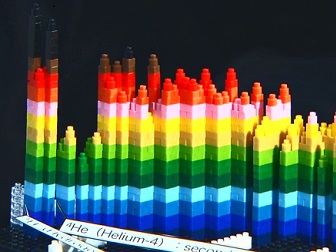
Three-dimensional-nuclear chart (under construction)
All the materials found on the Earth are made of atoms, where each atom is composed of electrons and a nucleus. A nucleus is ten thousand times smaller than an atom and is composed of protons and neutrons. To represent the properties of various nuclei, nuclear physics researchers use a nuclide chart, which is a two-dimensional (2D) chart that shows the number of protons on the vertical axis and the number of neutrons on the horizontal axis. These kinds of chart have been published by institutes worldwide. Our institute, JAEA, has also published these charts on a regular basis. By using this chart, users can obtain nuclear half-lives, nuclear decay modes, isotopic abundances, etc. However, such a chart is rather difficult to understand and is only used by experts. Recently, we constructed two three-dimensional (3D) nuclear charts with toy blocks, which represent the atomic masses per nucleon number and the total half-lives for each nucleus in the entire region of the nuclear mass. These charts have been used in outreach activities for the general public and high school students.Papers & Review
- Three-dimensional nuclear chart - understanding nuclear physics and nucleosynthesis in stars, Physics Education 49 215 (2014)
Selected as Highlight of 2014. - Outreach Activity: 3-D chart of the nuclides, Notes on Basic Science (Advanced Science Research Center, Japan Atomi Energy Agency), Vol. 21, No. 1, 17-19 (2013).
page top
GOTO HOMEPAGE of Hiroyuki Koura
